
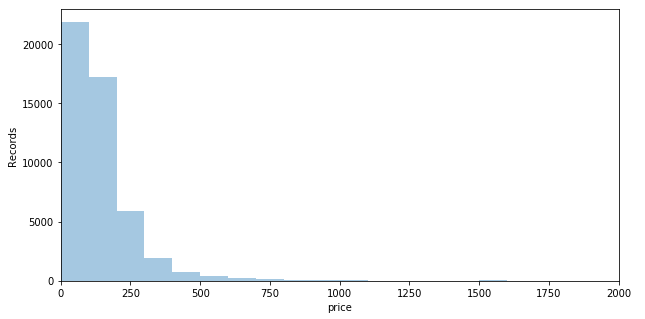
Seaborn Histogram
Python
 1|  plt.figure(figsize=(10,5))
 2|  plt.xlim(0,2000)
 3|  plt.xlabel('Price')
 4|  plt.ylabel('Records')
 5|  sns.distplot(data['price'],bins=100,kde=False)
 6|  plt.show()

133
121
116
109